
In the lee of Madeira Island, a famous-to-oceanographers formation occurs. To better understand ‘Madeira-Mode Water’, a team of researchers from the Oceanic Observatory of Madeira (OOM) set out in July, 2018, with an RBRconcerto³ CTD mounted to a Del Mar Oceanographic (DMO) Wirewalker and observed the daily thermocline cycle at a new level of detail.
From the Portuguese naval ship NRP Gago Coutinho, the team deployed the RBRconcerto³ CTD and DMO Wirewalker three times, totaling 158 hours underwater. This free-drifting profiler+instrument combination enabled the collection of 885 profiles of high-resolution spatial data, helping to uncover details of the Madeira-Mode Water as well as other ocean dynamics in this region, west of Morocco, with a complex bathymetry.
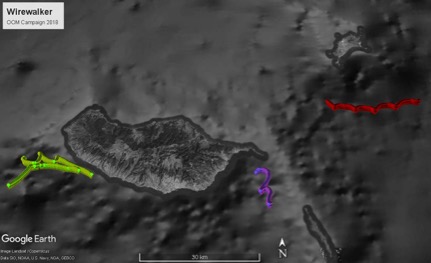
The study of the Madeira-Mode Water was part of a larger OOM campaign. The campaign first aimed to study deep flora and fauna in the submarine canyons around the island using a Remotely Operated Vehicle (ROV Luso, EMPEC, Portugal). Then began the study of the physical characterization of the submarine canyons and air-sea interaction processes, including the warm-wake, known as the Madeira-Mode Water. The latter study had two main objectives: the study of internal waves over a submarine ridge, and the study of the warm-wake of the island. The DMO Wirewalker was used to investigate these two processes. During deployment, the DMO Wirewalker also carried a Rockland Microstructure Profiler, which measured microscale turbulence and temperature variations.
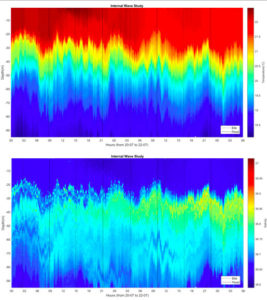
The first two deployments, which took place July 18th (Figure 1, purple points) and 19th (Figure 1, red points) respectively took 27 and 67 hours, examined the two sides of the island’s submarine ridge. Past studies of this region found evidence of internal waves generated by the interaction of currents and tides with the steep bathymetry of the ridge. The DMO Wirewalker, a free drifting profiler, allowed the collection of high spatial resolution data of the area, which helped to elucidate the influence of the waves and currents in the region. A first look at the CTD data of these deployments (Figure 2) shows some very promising results, including the passing of internal waves.
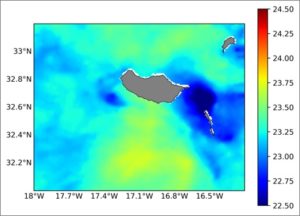
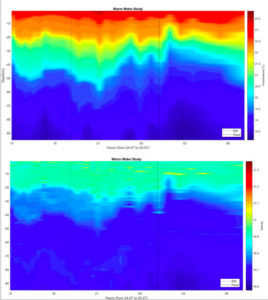
The warm-wake in the lee of Madeira Island forms due to the intense incident solar radiation on the sea surface (Figure 3). The third and last deployment began July 23rd, took 64 hours, and examined the warm-wake region. Data from a previous cruise showed the formation of convective cells inside this warm-wake, mostly salt-induced convection, as a response to the intense surface heating, thus increasing evaporation and consequently increasing the surface water density. This process generates a daily thermocline which dissipates overnight. In order to understand to what degree the convection process in the wake region contributes to the formation of ‘new’ water masses, it is important to have several 24-hour data cycles, which can be obtained with a continuous profiling system like the DMO Wirewalker. A review of the DMO Wirewalker data (Figure 4) shows evidence of convection cells, dislocating more saline water from the surface to greater depths.
Text written by Carolina Camargo, Rui Caldeira, Jesus Reis and Cátia Azevedo, Oceanic Observatory of Madeira.