Turbidity currents deliver sediment from the continental slopes to the deep ocean and threaten infrastructure such as submarine fiber-optic cables. The Coordinated Canyon Experiment (CCE), led by MBARI and USGS, used RBR turbidity sensors to continuously monitor the seafloor along Monterey Canyon for 18 months. The RBR turbidity sensors allowed the researchers to calibrate ADCP backscatter data and measure with new detail the profile of these energetic currents.
Spying the whales from the deck of the R/V Rachel Carson, Kurt Rosenberger and his colleagues pieced together their moorings: tying a surface buoy to its mooring wire, then as the ship steamed, letting out the wire and shackling instruments in turn, finally tying a train wheel to the wire, and using a tip plate to upend the anchor over their target locations along the thalweg of Monterey Canyon, California.
“There were so many whales around us spouting, it looked like we were at the Bellagio. There had to have been 15 humpback whales out there going crazy. That was the first deployment, in October, and that’s when the anchovies really start running and the whale population sky-rockets.”
That October day in 2015, they were deploying three taut-wire moorings – sub-surface and bottom-anchored – as part of the Coordinated Canyon Experiment (CCE). The study site, Monterey Canyon, is comparable in size and shape to the Grand Canyon, and consistently (at least one per year, according to Rosenberger) produces the CCE’s target events: turbidity currents.
Turbidity currents deliver sediment from the continental slopes to the deep ocean. They also threaten infrastructure, such as submarine fiber-optic cables, which, according to the United Nations report, Submarine cables and the oceans, route over 95% of international communications.
The CCE monitored the seafloor along Monterey Canyon continuously for 18 months, ending in March 2017. The experiment’s goal, in collecting more detailed information about sediment transport in the canyon than ever before, is to determine what triggers turbidity currents, what other mechanisms transport sediment through the canyon, and how sediment flows change the canyon’s shape.
“USGS had three moorings,” says Rosenberger, an oceanographer at USGS’s Pacific Coastal and Marine Science Center in Santa Cruz, California, “in about 300 m, 520 m, and 800 m water depth.” Other members of the experiment team, he explains, had moorings in 1400 m, 1700 m, and 1800-1900 m water depth, and alongside the deepest mooring, a bottom platform, where the energy of local turbidity currents is thought to run out.
That January a turbidity current took USGS’s shallowest mooring and transported it 7 km down-canyon. It might have gone further, but, “when it reached a knickpoint, a real sharp corner in the canyon, the mooring broke.”
This was not the first cable to be broken by a turbidity current.
…
The most famous turbidity current, the first to be effectively studied because it broke 12 transatlantic telegraph cables in sequence along the northwest Atlantic’s Grand Banks, was initiated by an earthquake, and in the initial slump of sediment produced a tsunami that, on November 18, 1929, killed 26 people along the south coast of Newfoundland. Analyzing the 28 cable break locations and timing, sonar data, and sediment cores from the current’s deposits, researchers determined the turbidity current’s speed – a maximum of nearly 70 km/hr – its sediment load and dynamics, and the tremendous power and danger of a newly discovered form of gravity current.
By the 1970s, researchers knew submarine cables were frequently broken offshore of some river deltas and across some submarine canyons: certain turbidity current locations and frequencies could be predicted.
Rosenberger says by the 1990s, USGS and others were putting instruments in their paths. “The success rate was not so high initially because people would place instruments on the bottom and then they’d get totally destroyed by the turbidity current.”
In 1994, he says, a team at USGS strapped an ADCP to a line at a height above a turbidity current’s path, keeping it relatively safe. “The taut-wire mooring might move a little and the turbidity current might lay the mooring down, but provided the mooring doesn’t break free, it will come back up once the turbidity current is over.”
[x_pullquote cite=”Kurt Rosenberger” type=”right”]‘That was really the first time someone had measured the profile of currents in a turbidity current. We were only measuring once an hour because at the time battery and memory were limiting, but we measured velocities up to 2 m/s.” ’[/x_pullquote]
Then, in 2002 in Monterey Canyon, USGS deployed taut-wire moorings with ADCPs for a year. “That was really the first time someone had measured the profile of currents in a turbidity current. We were only measuring once an hour because, at the time battery and memory were limiting, but we measured velocities up to 2 m/s.”
…
Broken free of its anchor, the buoyant CCE mooring surfaced and its Iridium beacon triggered a location alert email that Rosenberger remembers seeing in the middle of that 2016 winter night. “Hmm, our mooring’s up, I wonder what happened.” The line was soon picked up and called in by a fisherman. The instruments were intact; the only loss of data was subsequent to the break.
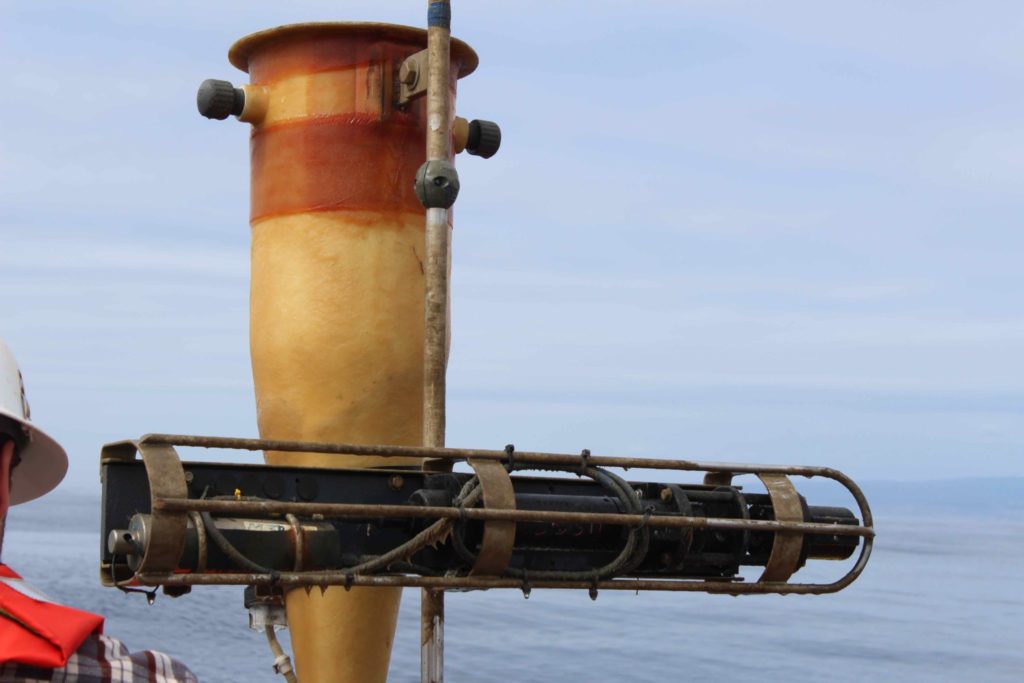
The instruments Rosenberger retrieved, and the same ones on the other USGS moorings, included an ADCP, sediment traps at 10 m and (on two moorings) 35 m and an RBR logger with an optical backscatter sensor and a transmissometer.
“We use the RBRs to capture the suspended sediment, which we can then use to calibrate the ADCP backscatter measurements, to attempt to get a profile of suspended sediment with ADCP backscatter.”
This time, they measured every 30 seconds, a high rate, because when a current hit, “we’re more likely to capture the true peak velocity of the event.” They recorded turbidity currents flowing at up to 7 or 8 m/s.
That March, of 2016, the team retrieved their moorings, changed batteries and downloaded the data, putting the moorings, including the previously broken one, back in the water for the summer.
The CCE’s full suite of data collection included repeat mapping surveys with AUVs at several locations along the canyon axis, and Benthic Event Detectors (BED) developed by MBARI: “It’s basically a little beach ball, but it’s got very high accuracy, high data rate accelerometers and a pressure sensor built in so it’s meant to detect not only the large events of a turbidity current but also to detect if there might be very slow creep within the bottom of the canyon.”
Rosenberger calls the BED system impressive, describing how a glider downloads data acoustically from the BEDs, even if buried in a meter or two of sand.
When October came around again, preparing for winter and more and stronger turbidity currents than they expect in summer, the team anchored their moorings using two train wheels, which led to other unanticipated consequences. “We had almost record rainfall in California [during Winter 2016-2017], and almost record wave events, moving sand around and filling up the canyon with sand, so we had many more events in the second winter.” The double train wheel kept the mooring from sliding as far down-slope, but instead turbidity currents dragged the whole line down into their path, banging up equipment that, 100 m from the seafloor, Rosenberger thought to be safe.
“We got lucky on the last deployment. Several of the brackets that hold the instruments on were broken – they were holding on by a thread – so when it came up to the surface, it was a tangled mess. … We got lucky. They survived. We got data until some of the instruments themselves were damaged.”
“Did we learn what we want to learn? We haven’t gotten that far with the data, but we certainly gathered the data that we hoped to collect, and then some.” Rosenberger notes enthusiastically, “The data will be made available to the public and will probably be mined for years.”
—
The CCE was conducted as a partnership between Monterey Bay Aquarium Research Institute, the United States Geological Survey (USGS), the Ocean University of China, the National Oceanography Centre in Southampton, England, and the University of Hull, England.
Special thanks to David Piper, of the Bedford Institute of Oceanography, for your insights into the history of the study of turbidity currents.