Leaning over the side of the 22-foot boat and pulling up the first line of temperature sensors, oceanographer Jamie MacMahan described the state of the line as the worst bio-fouling he had ever seen. It was slimy and smelly. One down, 34 more to go.
This was only a pilot project, but MacMahan’s mantra of ‘Go big or go home’ meant that more than 300 instruments were attached to the arrays of moorings his team deployed offshore of California’s Point Sal State Park.
MacMahan, an associate professor of oceanography at the Naval Postgraduate School in Monterey, California, is studying how water moves in the nearshore, the region from twenty meters of depth to where waves start to break at about four meters. He wants to know how and if water is transported from the deep to the shallow and vice versa.
Temperature as a tracer
To track water movement, MacMahan identifies volumes of water by temperature. With data like those collected at Point Sal, MacMahan can identify physical ocean dynamics, such as rip currents, upwelling, and internal waves (enormous slow-moving waves that ride a density boundary below the ocean’s surface).
“From a processes point of view, temperature’s a great tracer. It’s not perfect though,” says MacMahan. If the temperature of a volume only changed from direct contact and mixing with water of a different temperature, the team could account for all changes. Instead, the sun heats the water during the day, and it cools at night, so sampling must be done at a relatively high frequency – in this case 1Hz – that way the mass of water being followed isn’t lost in other changes in temperature.
Challenges instrumenting the nearshore
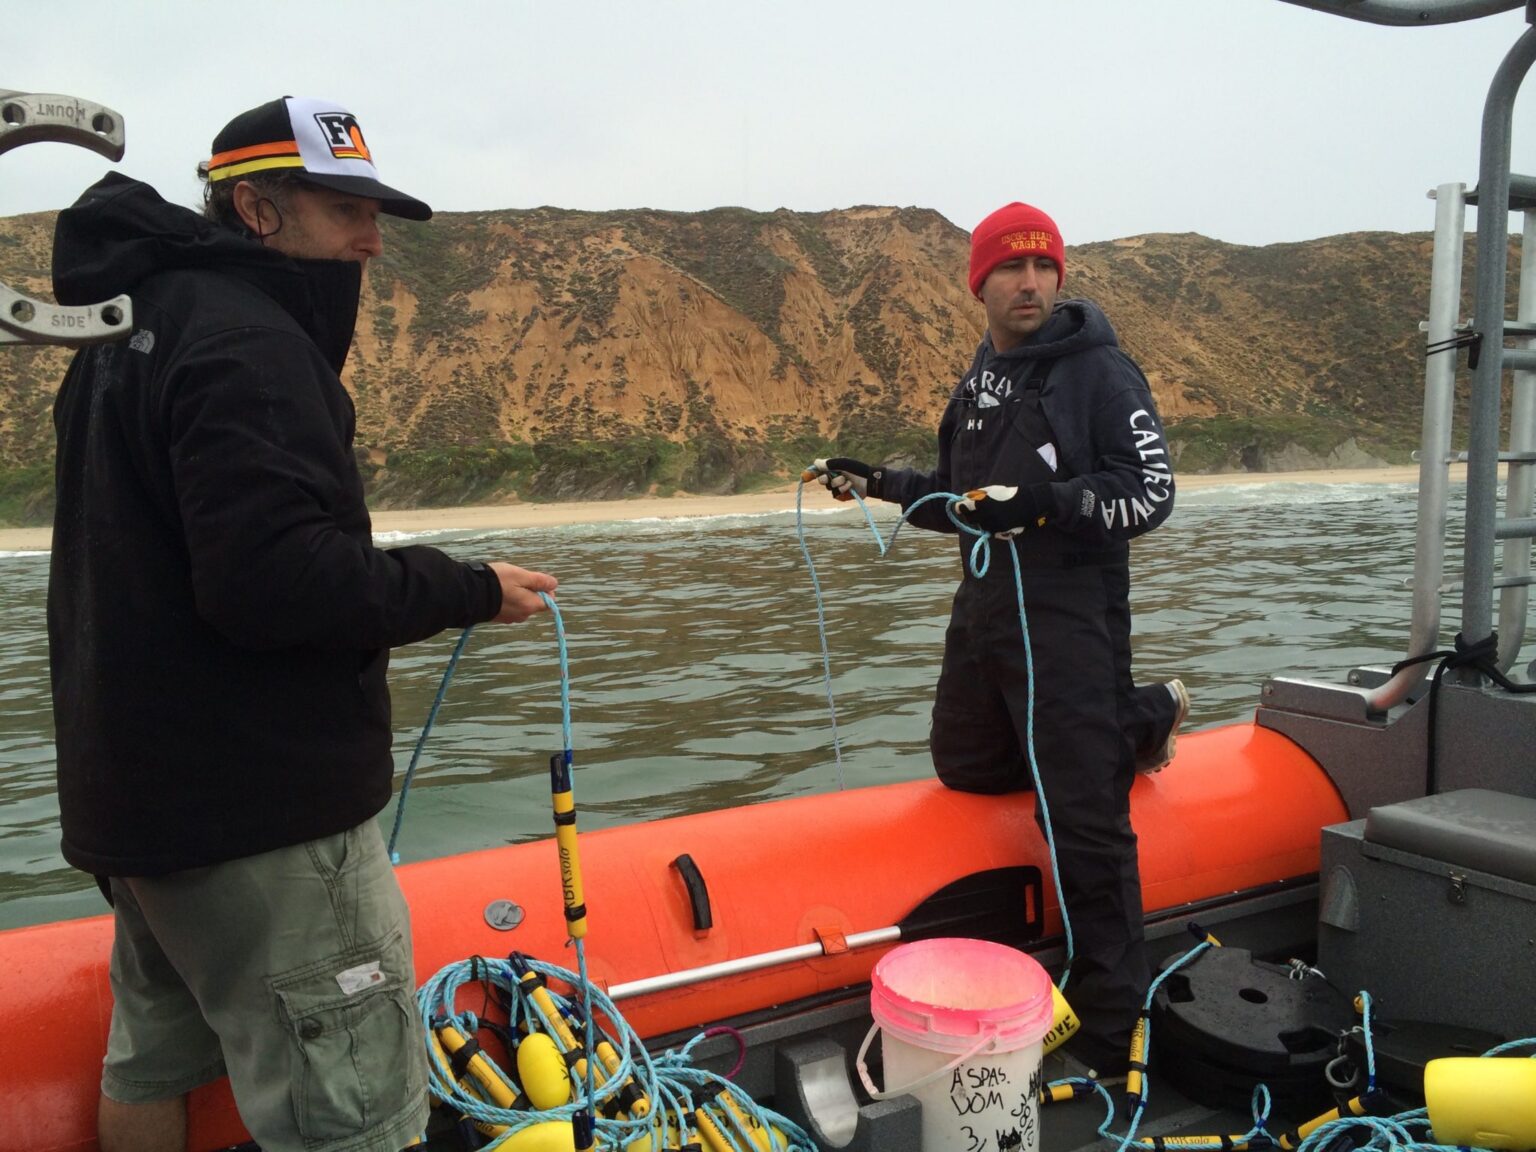
Beyond choice of tracer, there are several inherent difficulties studying this shallow and energetic ocean region. Waves, heavy currents, and the motion of sand on the bottom make the region ideal for deployment using a large vessel, one with a winch. But big ships can’t get into the shallows, where MacMahan was headed: “The idea was, how are we going to deploy 30 stations from a small RHIB (rigid-hulled inflatable boat) and ensure that they will survive for two months, and at the same time, if something went wrong, what checks would we have in place to determine if the system failed?’”
It came down to design. The common solution is for scuba divers to jet poles into the sand as anchors to which lines would then be attached. “That is almost 100% return on your data, but then that’s logistically expensive,” MacMahan says, “It would probably take five days, maybe more. Based on the weather patterns, we felt we only had a two-day window to deploy or recover.” Instead, they used 35-lbs barbell weights as anchors (one in shallow water and two where it was deep), attached their lines to crab buoys for buoyancy, and dropped the moorings off the side of the boat.
Mooring design
Usually an oceanographer who wants to measure temperature at a number of depths would use a t-string, a line with integrated temperature sensors at preset positions along its length. MacMahan did something different.
“I wanted to attach temperature sensors to lines so I had flexibility. You’re always designing something. If you would buy the t-strings ahead of time and then the project changes, or you go, ‘oh, there’s this cool rocky outcrop. Wait, we’re all set up for this standard system,’ you can’t adjust to that. As scientists doing fieldwork, you’re always re-evaluating your design, even to the last minute. You want to optimize it. So I wanted to go with independent temperature sensors.”
Attached to each of the 35 lines were six to 12 RBRsolo T temperature loggers, which sample at up to 2Hz for up to six months. The lines also had a tilt sensor mid-line, which would indicate if the line remained vertical in the water, and a pressure sensor at the bottom to indicate movement of the mooring. Using “regular key rings,” MacMahan and his team attached the temperature sensors to the lines by feeding the key rings through the hole on the top of the RBRsolo Ts and through the line. “Then we taped the RBRs to the line so they’re basically part of the line.”
The reason MacMahan wanted the sensors to be part of the line is simple: kelp. It’s a constant hazard to instruments along the California coast. “If you have anything that can snag the kelp, it will get stuck on the line, and because the kelp is so massive, eventually it’s going to start dragging your mooring.”
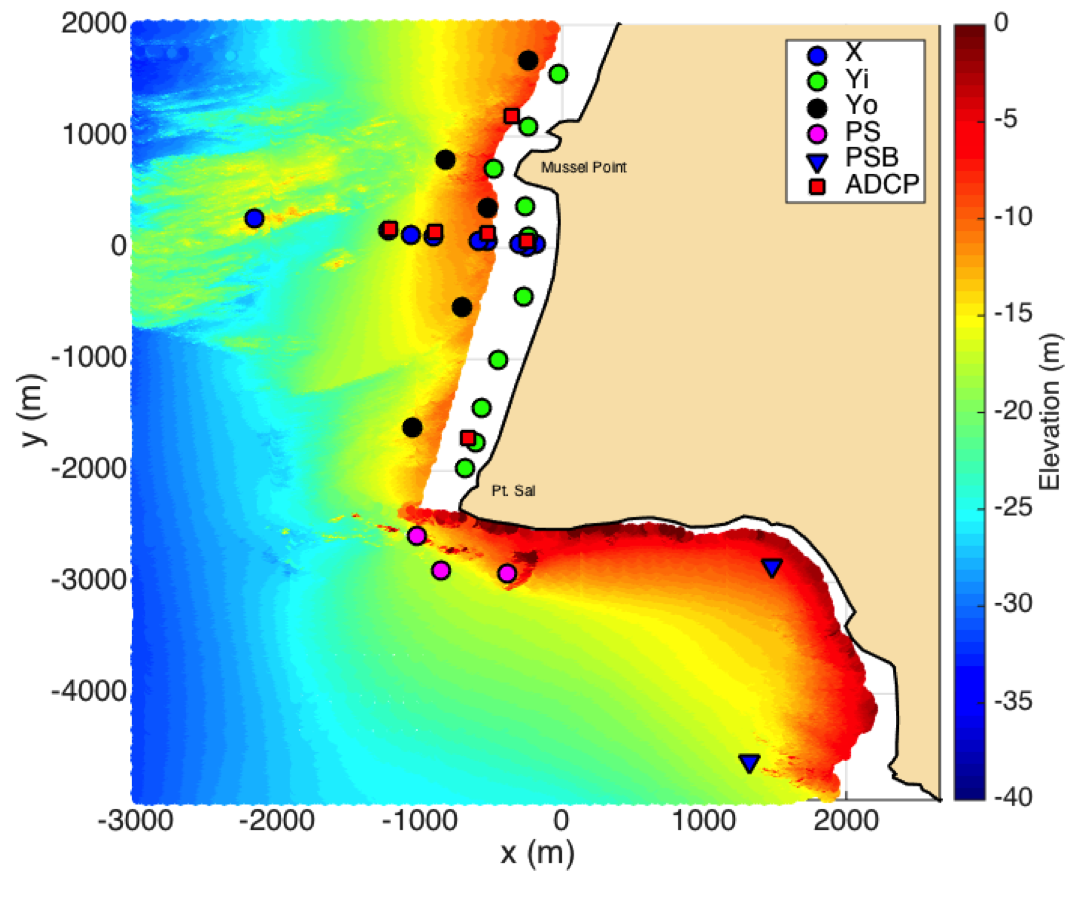
On two consecutive early days in June 2015, MacMahan, his Ph.D. student Thomas (Tucker) Freismuth, a technician, and two volunteer graduate students took the hour-long trip from the nearest boat launch to Point Sal. There, they assembled some of the equipment in the boat and deployed their 35 moorings, including six ADCPs (Acoustic Doppler Current Profilers) to measure current velocities and directions, in predetermined locations.
“We designed various arrays to look at along-shore variability and cross-shore variability. [Each mooring] provided double duty as far as providing cross shore and alongshore information.”
“We’re past the point, scientifically, of exploring stuff on straight and parallel beaches.”
At Point Sal State Park there is the eponymous rocky headland jutting into the sea, a sandy beach and rocky outcrop to its north, a pocket beach and rocky bottom to its south, and off-shore are submerged rocky outcrops. “It’s a really cool, complex area,” says MacMahan. “We’re past the point, scientifically, of exploring stuff on straight and parallel beaches.”
There was no beauty in recovery, however. On the first of the two days, the team tried to clean bio-fouled lines as they heaved them aboard, but they quickly gave up the effort and filled the boat with gunk. “It’s a nice sunny day, and with the very first one, you’re covered in slime and mud. For our moorings in shallow water, so about 12 to 15 meters or less, we used a 35 lb weight. The ones offshore were 70 lbs, so we had to haul in 70 lbs. And pulling those in with a slimy line was very tough. We were disgusting. It was wretched.”
Despite being slimy and stinky, the researchers were also thrilled. Their plan had worked – they had deployed their instruments in a new way that seemed dangerously simple. If they’d judged wrongly, they could have lost their load of instruments, and the season’s data. Instead, they found all moorings were intact, and all but three had stayed put against the waves, currents, and kelp.
‘A temperature-rich environment’
On returning to Monterey, Freismuth downloaded the data, found he had a recovery rate of 99%, and began the analysis that will be the basis of his doctoral work. What Freismuth saw in the data, MacMahan describes as “a temperature-rich environment.”
To Freismuth, the biggest driver of temperature variability was a surprise: “When we started analyzing the data, it looked like internal waves coming from offshore were overwhelming our signal. These internal waves are transporting warm water into the inner shelf and potentially into the surf zone.”
Freismuth has been working to complete his analysis quickly, because the results of this pilot project are being used to inform the main deployment in Fall 2017. The upcoming study involves over 30 principle investigators. “What we’re trying to do is get every measurement from 50 m to the beach,” MacMahan says, “from measuring directly to measuring indirectly.”
Go big or go home
‘Every pilot experiment you do, make sure it’s almost as good or better than the real experiment because with nature, you don’t always get a second chance.’
Ever since MacMahan was a postdoctoral fellow under the supervision of Ed Thornton, he has worked alongside his mentor. MacMahan attributes his ‘Go big or go home’ mantra to Thornton, which led to success in this and past deployments. Thornton recalls, “I said, ‘every pilot experiment you do, make sure it’s almost as good or better than the real experiment because with nature, you don’t always get a second chance.’”
Thornton, whose career as a nearshore oceanographer began in the 60s and hasn’t ended (even though he’s technically retired), adds: “I learned that the hard way.”
“If they hadn’t done this comprehensive attempt you wouldn’t know what scales to even look at and how those scales would tie into larger scales,” Thornton says. In fact, the team had such success in recovering data, and with such an extensive set, that their 2017 plan involves extending their target area from three miles along the beach, to 30.
“I don’t think we did anything crazy here,” says MacMahan. “The only thing we did that I think was ingenious was to really make this a lightweight package that you can deploy overboard with humans.” Of the systems the team deployed, he says, “I’ve learned that it’s so easy, it’s so simple, but it’s very robust.”
“I’m a little more of a risk taker, in that I considered the risk and odds of doing this lightweight system,” he says, “but the idea is that the return is much better if it’s successful. I evaluated the risk versus the reward, and, you gotta go for it.” Go big or go home.
Dr. MacMahan’s work is funded by the Office of Naval Research.