The Salish Sea, located on the west coast of Canada, is bounded by the lower mainland of British Columbia to the east, Vancouver Island to the west, and the state of Washington to the south. This Sea is a bustling location, with millions of people living along its shoreline and numerous vessels sailing through its waters daily. It is also home to the Southern Resident Killer Whales – a declining species of whale located in the eastern Pacific.
We interviewed Dr. Svein Vagle, a research scientist at Fisheries and Oceans Canada (DFO) out of the Institute of Ocean Science (IOS) in Sidney, BC, about his project that aims to better understand the effects of shipping sound on the Southern Resident Killer Whales in the Salish Sea.
Answers below have been lightly edited for clarity.
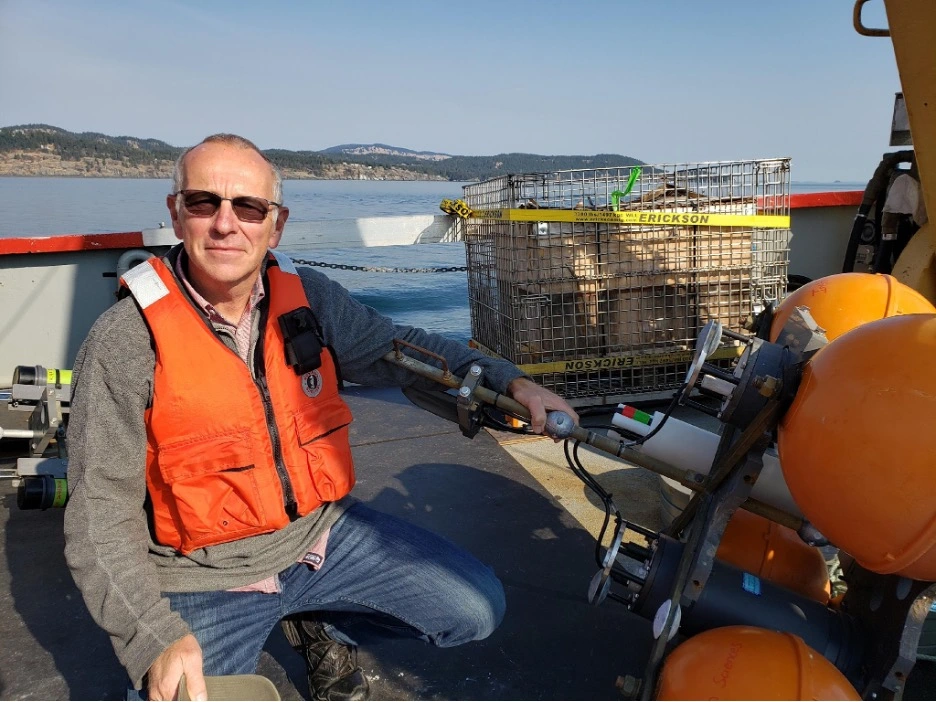
When and why did you start this project?
Svein Vagle: In 2017, the government felt they needed to do something about the Southern Resident Killer Whales, as their numbers had been declining. DFO started funding a program under their Oceans Protection Program (OPP) to try to address this.
What are the main goals of the project?
A small team of us were asked to put together a program to see if we can deal with the noise issues and the impacts on the killer whales. I am on the physical side of things. I have colleagues at Pacific Science Enterprise Centre (PSEC) [in West Vancouver] that focus on the biological side. There are six of us that form the team here at IOS; we are trying to do measurements of the noise in the Salish Sea and also some modelling of noise from vessels, and so on.
What does your monitoring of the Salish Sea look like and how has it evolved over the years?
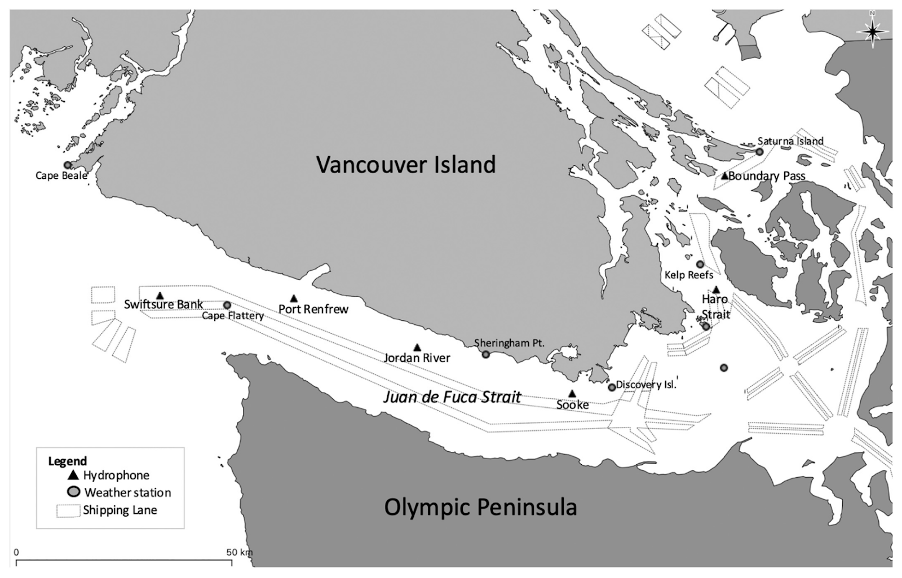
When we started out, in February 2018, we put in six passive acoustic moorings in the Salish Sea, on Swiftsure Bank, in the Strait of Juan de Fuca, in Haro Strait and in Boundary Pass. Later on we have also expanded into the Strait of Georgia. It looks like killer whales are spending more and more time at or around Swiftsure Bank, so we’ve added recorders in this area in later years.
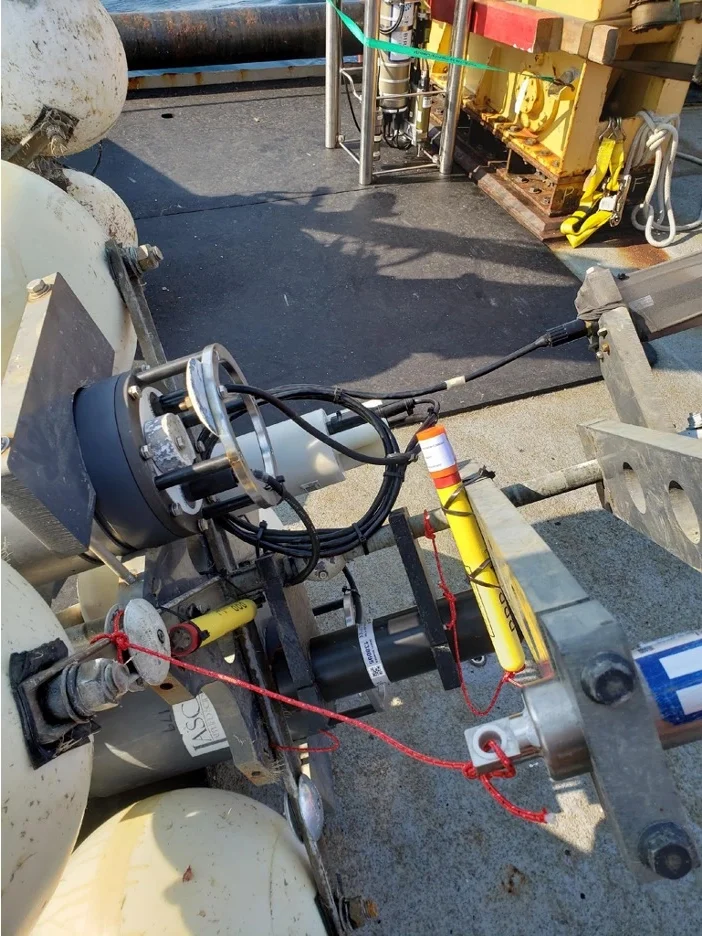
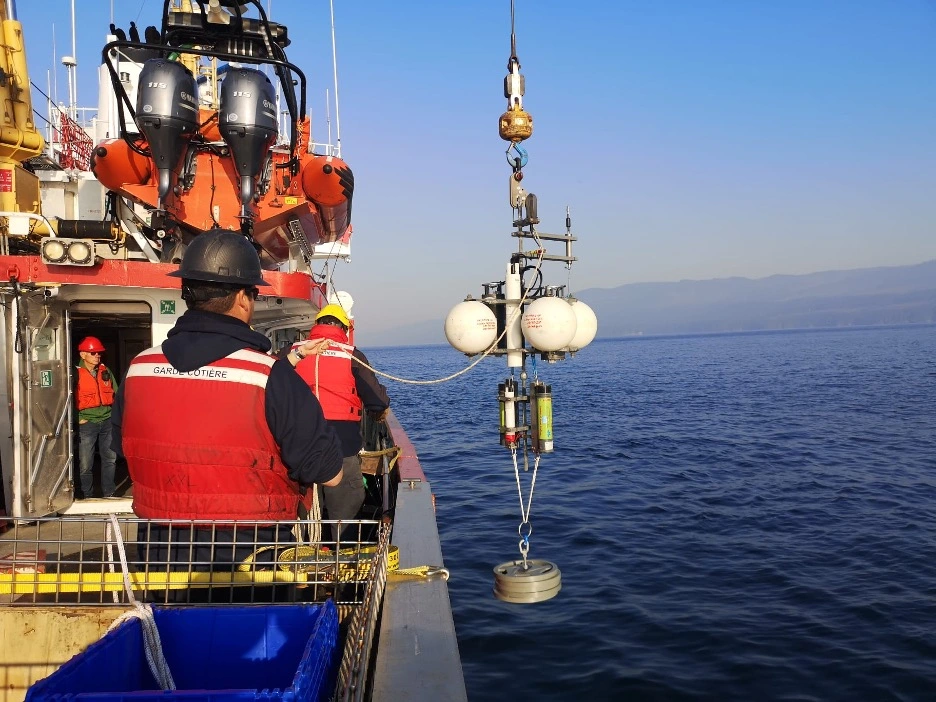
These moorings sit 2m high with weight plates as anchors and hydrophones at the top. They’re placed so that they aren’t too high in the water column and so that they are as quiet as possible, so as not interfere with the acoustical signals we are trying to measure.
So we started putting these moorings in but it turns out that to better interpret the data, we need to know about the sound-speed: the sound-speed in the water column is very critical to how the sound propagates. So we needed to measure temperature and salinity and ideally depth.
We started using old RBR loggers that I had – we just strapped them onto the moorings. But then we managed to find some money to get the sound-speed at the mooring locations so we bought new RBR CTDs and we now have one on each mooring. They’re collecting data every 30 seconds, giving us temperature, salinity and depth. Then, we can start using that information to calculate sound-speed as a function of time, which is of primary interest for us.
How is speed of sound in water calculated?
People years ago did lab studies to get sound speed relationships from temperature and salinity measurements. Typically to do these types of experiments, scientists send sound over a fixed length and measure the time. Scientists then started to look at these at different salinities and temperatures and came up with these curves and fits [to describe the speed of sound based on temperature and salinity].
So we now have these polynomial fits, and the RBR Ruskin application actually spits out sound speed using different relationships, for example Chen and Millero, etc. These relationships are so close to each other for our purpose that it doesn’t matter that much which one we use. It’s when people go down to 5000m in the deep ocean and really want to look at fine details that it’s important to pick a specific relationship. They’re pretty straight forward relationships; we plug in pressure, temperature and salinity [from our CTD and into one of these relationships] and it spits out the sound-speed. We use those numbers in our models to look at the propagation of sound.
Why did you choose to use RBR CTDs for this project?
I started using RBR back in the 1990s and really like how easy to use they are, particularly the new iterations. I really like these new CTDs with their WIFI download – it’s pretty slick. I really like their reliability, how easy to use they are, and how compact and accurate they are. Plus, because we are setting them to take measurements every 30 seconds, the batteries last on average seven years or something.
What are some results that you have collected so far from this work?
On the acoustic side, we certainly are finding significant differences between the different areas where we have recorders. For example, the moorings at or around Swiftsure Bank have significant wind generated noise in addition to noise from commercial vessels compared to further into the Strait of Juan de Fuca where vessel noise dominates.
Additionally, Port of Vancouver has been introducing ways of decreasing noise by asking ships to slow down, and by moving further offshore within existing shipping lanes, and by creating interim sanctuary zones where no boats are supposed to go. We have a recorder in the middle of these areas, so we can monitor the impact of these mitigation measures on the soundscape. For example, in Haro Strait/Boundary Pass, there’s clearly a reduction in noise from slowing down of ships.
Are there any unanswered questions that you’re particularly excited to address?
There’s a lot of variability in the acoustics. One of our hypotheses is that with different water masses, with resulting changes in sound-speed characteristics, the soundscape will be affected. A colleague on our team, Robyn Taves, is now looking at all the oceanographic data we have collected over the last six years so that we can see when a big system of water masses is coming into the Strait and how that is related to the acoustics.
Robyn is really hoping to find something interesting in terms of seasonal and year to year trends. We’re getting quite a few years of data now, and can start looking at how the Juan de Fuca Strait behaves near the bottom. For example, is it affected by offshore storms? Or from freshwater from the Fraser River?
The Strait of Georgia is also particularly interesting because in the spring it gets all of this freshwater from the Fraser River on top. This gives a totally different profile which affects sound propagation. It’s totally different acoustics in the summer versus winter, etc.
What are the next steps for this project?
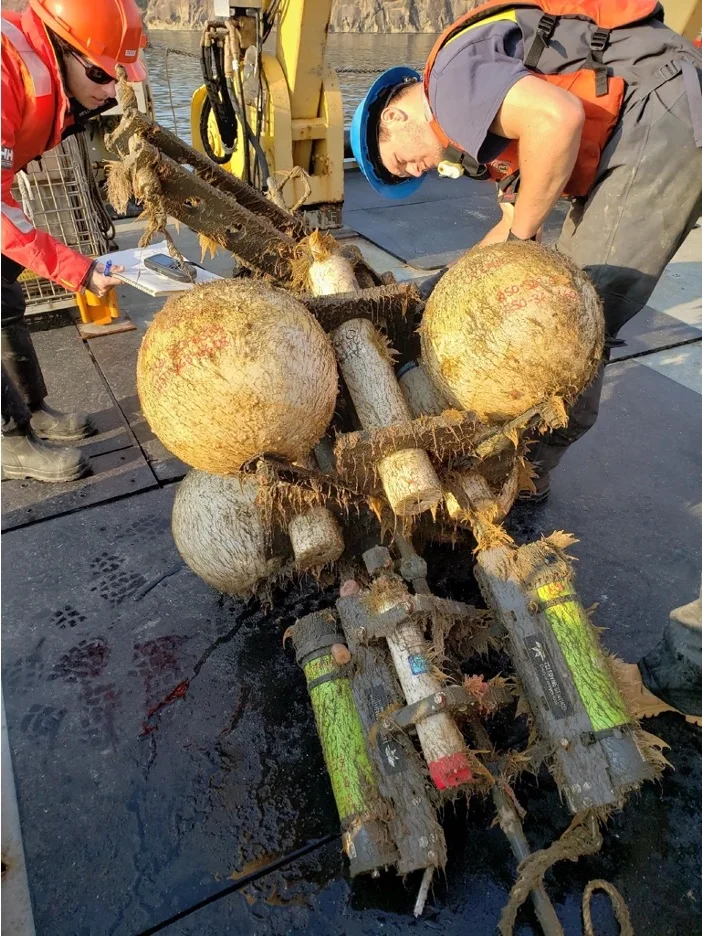
There’s a lot of talk about us expanding our program to Prince Rupert, so that’s where we are headed. We want to continue with the same type of equipment; we’re happy with those moorings and gear that’s on them. To expand north, we got funding for two more moorings and then we are going to pull 2-3 moorings that are more local at least to start with. Going north will be harder logistically, so we might need to start collaborating with more people.
We also want to see if we can do more off Roberts Bank: there’s a big port just north of the Tsawwassen Ferry terminal there, and they want to expand it. There’s been a lot of environmental impact assessments, so they want us to go in and measure the noise over there as well.
We are finding the value of our dataset increases every month by making it longer and longer, so we really want to keep going the way we are. The dream would be to have an acoustic mooring near a full oceanographic mooring, because then we can really get the water properties, with ADCPs, currents etc., and see how it all relates to the acoustics.
Story by Krysten Rutherford