
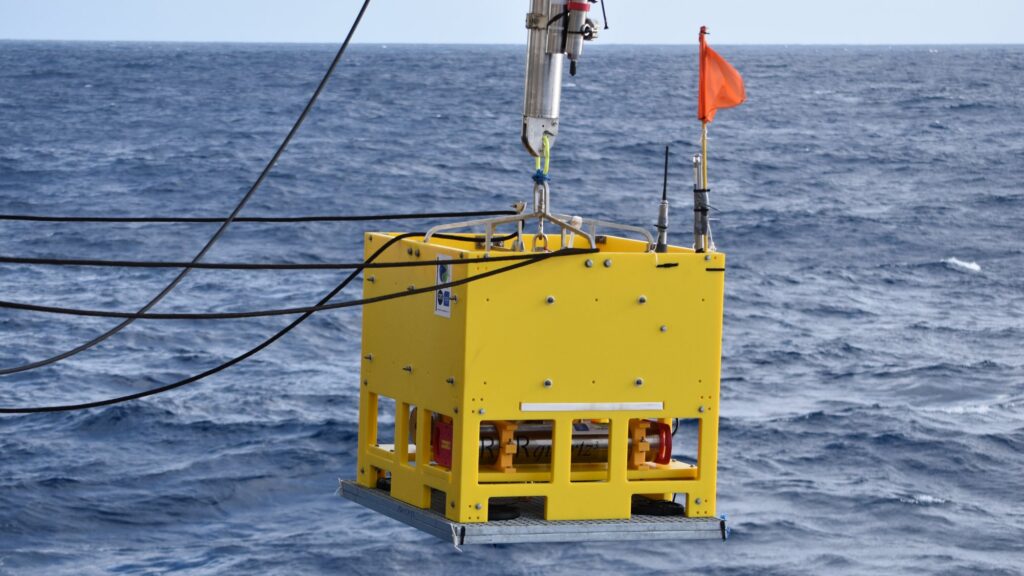
In April 2024, scientists captured what is believed to be the first in situ observation of a major seafloor-rifting event as it unfolded. Just two months after an autonomous observatory was deployed on the Southeast Indian Ridge, a sequence of earthquakes triggered around 4m of seafloor subsidence (vertical displacement) and more than a metre of horizontal extension (spreading). Published in Nature, the resulting study provides an unprecedented view of how tectonic and magmatic processes interact as new oceanic crust forms. Hydrophones, acoustic-ranging beacons, seafloor mapping, and RBRquartz3 BPR|zero pressure measurements combined to capture the event in detail.
Here, Jean-Yves Royer (Emeritus senior scientist, French National Centre for Scientific Research (CNRS) in Brest) and Valérie Ballu (CNRS Researcher in La Rochelle) take readers behind the scenes to explain how the experiment was designed, what the instruments revealed, and how their ongoing collaboration with RBR is helping them investigate what happened before, during, and after this exceptional event.
Your team managed to capture something that seems to be unprecedented in scientific literature: the first in situ observation of a rifting event as it unfolded on the seafloor. When did you realise you had captured something exceptional?
Jean-Yves: We set up the experiment in February 2024. Then, in April 2024, global seismological networks, which are based on land, recorded a series of large earthquakes in the area where we had set up our experiment. The problem was that, since these networks are quite remote, the uncertainties in the earthquake locations were large—between 20 and 50km. So, we didn’t know exactly where the earthquakes had occurred, but we knew they were in this area. Of course, we were eager to get back and see what our instruments had recorded. We went back in January and February 2025, and we were very excited to get there.
The first thing we did was to analyse the records from the hydrophones. The principle is that you pick the arrival times of acoustic waves generated by earthquakes on each instrument, and since you know the location of each instrument, you can triangulate and locate the sources. We were able to locate the large earthquakes precisely, and they were right on the very segment that we had instrumented. All the events were perfectly aligned on the segment. That was the first surprise.
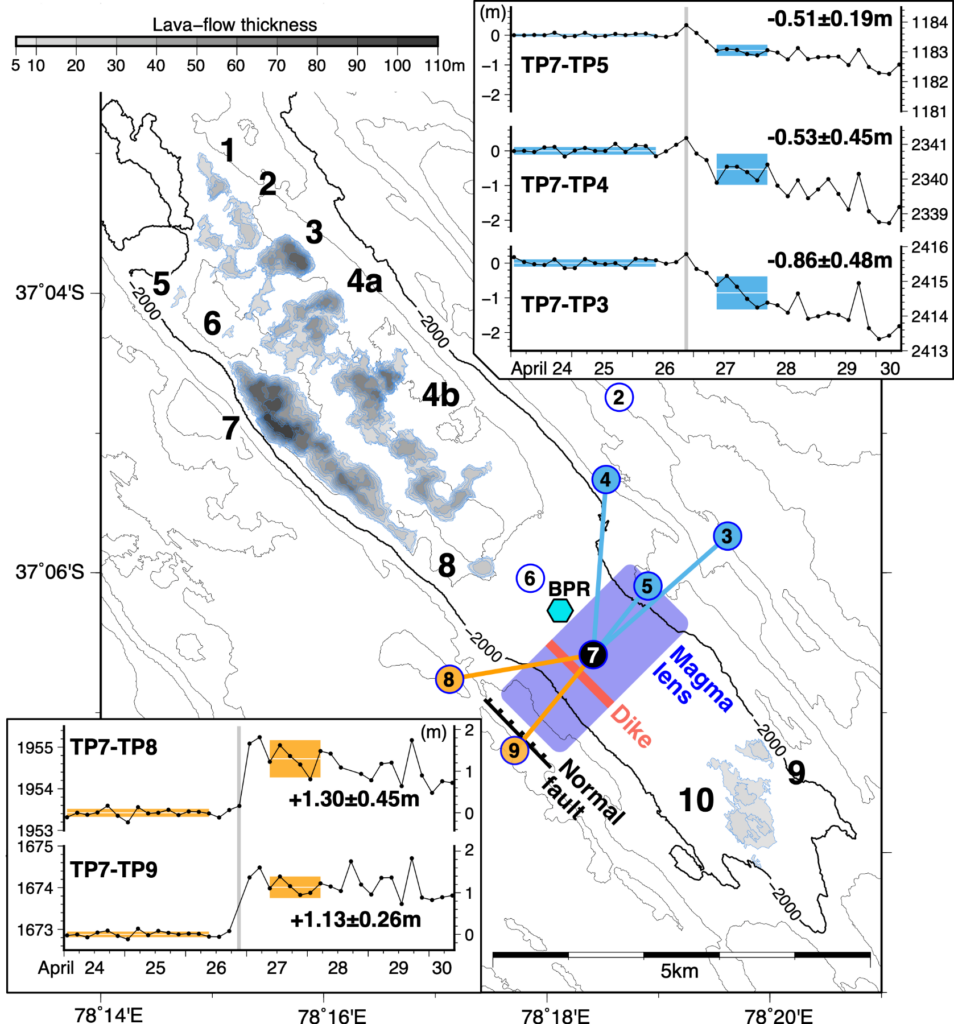
Then we recovered data from the acoustic beacons, which send signals (i.e. ranging) to one another six times a day. We retrieved only one beacon, which was located in the centre of the network in the axial valley and had communicated with all its neighbours. So, we had a series of distance measurements to beacons on either side of the axial valley. At the very time of the earthquakes, we saw a major change in the baselines, spreading from about 1m to 2m.
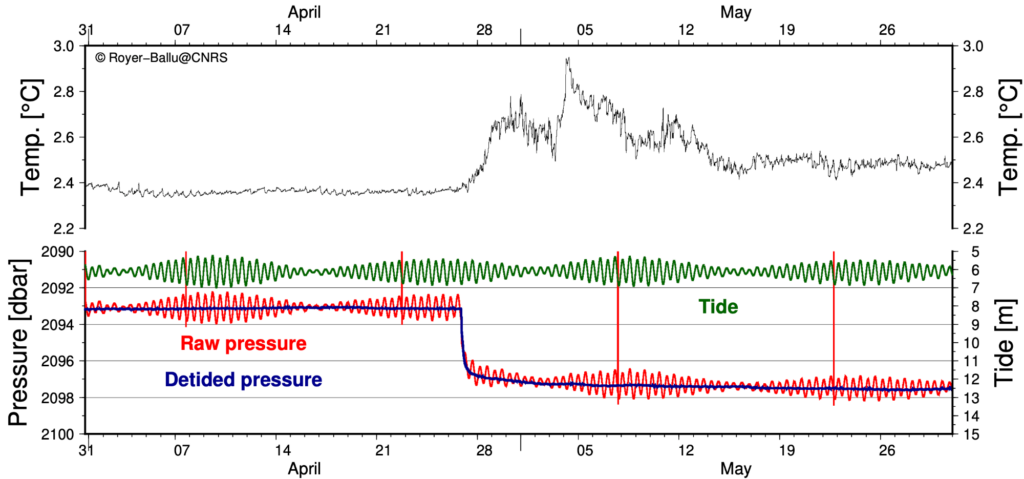
The next step was to recover the RBRquartz3 BPR|zero bottom-pressure recorder (BPR). It came up to the surface, we collected it, and we looked at the data. To our surprise again, we measured a displacement of about 4m. The seafloor had collapsed by 4m, precisely at the time of the very large earthquakes. When we put everything together, the instruments recorded a major event at the same time.
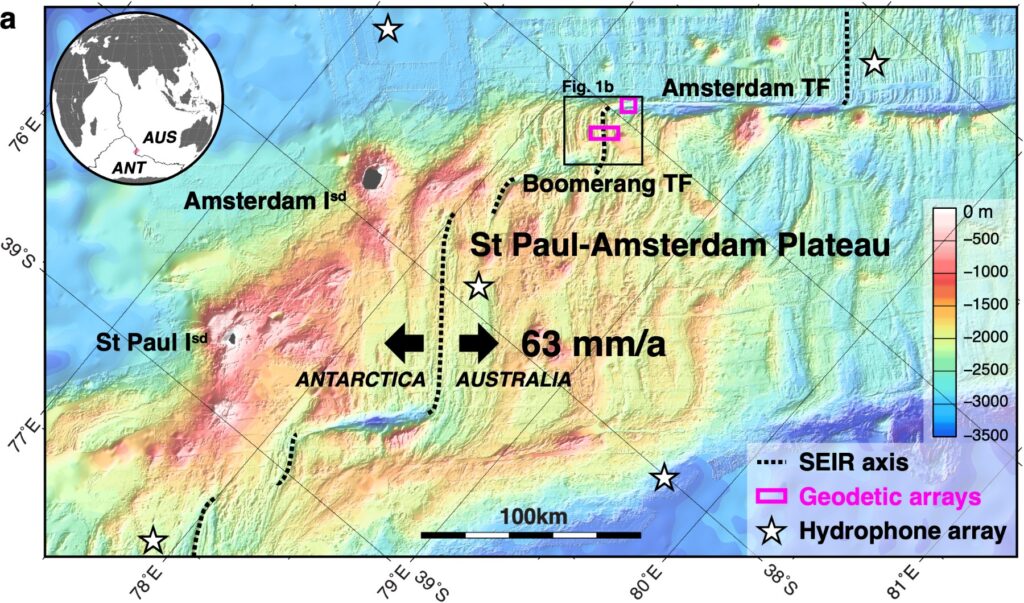
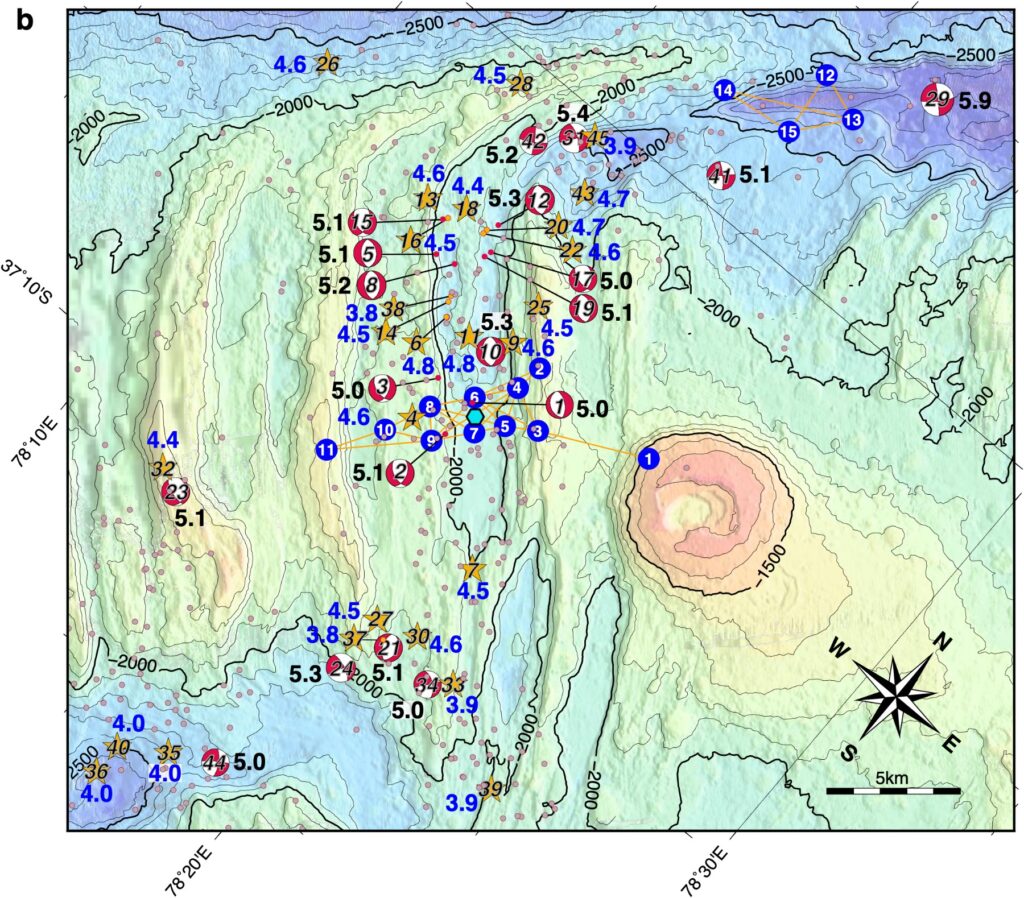
Finally, after conducting a swath-bathymetry survey of the area and comparing it to the 2024 survey, we identified a major eruption on the axial valley floor, up to 160 million m3 of lava (90m high in some places). The temperature rise measured by the RBRquartz3 BPR|zero precisely dated the onset of this eruption. Lava flowed only 900m away from the BPR. We were lucky that none of the acoustic beacons or the BPR got buried in the process.
While the Southeast Indian Ridge is active, you hadn’t necessarily set out to capture a major rifting event. What had you initially set out to investigate?
Jean-Yves: The seafloor is built by seafloor spreading along mid-ocean ridges. The mid-ocean ridges form a volcanic chain about 65000km long, crossing all the oceans: the Atlantic, Indian, and Pacific oceans. The displacement of the plates due to seafloor spreading can be measured using Global Navigational Satellite Systems (GNSS), such as the Global Positioning System (GPS), and so we know the average speed at which the oceans are opening up. It goes from less than 1cm per year to up to 16cm per year. These rates are averages based on 20 or more years of GPS measurements, so it means that plate motion is very steady and continuous.
However, nobody really knows what’s happening at the scale of a spreading segment, which can be from a few kilometres to 100km long. Nobody knows whether they crack or open up every day, every month, every year, every 10 years, or even longer periods. The main question we had was: on a segment scale, as the plates are spreading apart, what is the proportion between the two types of processes—tectonic (i.e. faulting) or magmatic—occurring as the plates move apart?
How do you set up an experiment to measure these smaller changes in a ridge segment?
Jean-Yves: The only way to know how the seafloor is changing at that scale is to be able to measure seafloor displacements. To do that, we had to gather a number of instruments.
First, we needed to measure horizontal displacements. For that, we use acoustic beacons laid on the seafloor. They measure the distance between them several times a day, so we’re interested in seeing how those distances evolve through time. We placed the acoustic beacons on two lines perpendicular to the spreading ridge, or, if you like, parallel to the spreading direction.
We also wanted to measure vertical displacements. For that, we use bottom pressure recorders (BPRs), like those built by RBR, such as the RBRquartz3 BPR|zero.
To complement these observations, we installed a network of hydrophones in the water column over a broader area to record seismic activity associated with tectonic or magmatic processes. That gives us an idea of the regional seismicity because, of course, if you pull apart oceanic crust, it will generate earthquakes when it fails. That’s how we built the experiment.
As you were planning out instrumentation, what were your key requirements?
Jean-Yves: When we first thought about the experiment, the instruments we needed didn’t really exist. We needed autonomous instruments that were very precise because we wanted to measure displacements of millimetres to centimetres per year over several years. To increase our chances of measuring anything at all we decided to conduct the experiment over a three-year period.
The two main requirements were precision and autonomy. It took several years to set up the observatories because the instruments we used were still relatively new: some were still in the prototype stage, while others, although operational, had never been tested in a deployment of such duration and for such purposes.
Why was the RBRquartz3 BPR|zero important to the experiment?
Valérie: Jean-Yves described our interest in understanding the interplay between faulting and magma emplacement. We’ve been trying to capture that for a long time.
In particular, we have an experiment on the Mid-Atlantic Ridge—an observatory that has been there for about 15 years. We see changes and trends in the pressure data, but it’s impossible for us to distinguish between instrumental drift and actual slow motion. It could be slow motion on a fault, for example, that doesn’t produce an earthquake at the same time. You have no way of distinguishing between instrumental drift and seafloor motion. As a community, we were already interested in capturing that.
In the framework of a large French project called MARMOR, aimed at developing an instrumental facility for observing the seafloor, we chose to purchase self-calibrating pressure gauges such as the RBRquartz3 BPR|zero. They were perfectly adequate to address the questions Jean-Yves mentioned: Are the faults moving slowly? How is the axial valley forming? Is the magma rising towards the surface, or emplacing below the surface?
We needed to be able to measure very slow and small displacements, again of the order of few millimetres or centimetres, and for that you need to account for instrumental drift and monitor it. That’s why we started discussing the project with RBR and eventually put out a call for tender. RBR responded, and since that first purchase, we’ve worked well together. We’ve had a lot of exchanges with the engineers in Canada, in particular Jean-Michel Leconte, and this collaboration has helped us improve the instruments.
This instrument was fully suited to our needs. But we were not expecting to capture 4m of vertical displacements, which far exceeded the instrumental drift and accuracy. Thanks to the two accurate sensors and 1s sampling interval, we were able to identify many short events, less than a centimetre, which add up to 4m in total.
Why was a 1s sampling interval important?
Valérie: We don’t need 1s for every question, but a shorter sampling interval is very important if you want to understand processes involving earthquakes and relate everything together. With that sampling period, we can unravel the chronology of events and understand how the magma chamber collapsed, how the dyke propagated, and how these events relate to the earthquakes.
Jean-Yves: We were very successful. The strange thing is that we set up these instruments to measure perhaps less than a centimetre per year of displacement because we expected seafloor spreading to be gradual. Instead, we measured metres of displacement, both horizontally and vertically. So, we were lucky with the timing!
Having captured this major rifting event, where do you go from here?
Valérie: What we need to progress on now is what occurred before the event and what occurs after the event.
That requires very careful analysis of the drift. This is something we’ll continue working on with the RBR team: getting down to very slow-motion detection. It requires more research, and it will be of key importance because we detected a unique event. For instance, were there warning signs, such as a vertical motion indicative of an inflating magma chamber below the seafloor? That’s going to be the next months and years of work.
In 2025, we deployed not just one RBRquartz3 BPR|zero, but three of them together. We’re hoping to learn more about the relative displacements across the axis and how the seafloor readjusts after such an event.
Jean-Yves: As Valérie mentioned, what we’re after now is the aftermath of this major event, because everything is readjusting. There is still some seismicity, but the events are much smaller. That tells us about the mechanical behaviour of the oceanic crust after such a big event. So, scientifically, we’re interested in having a full picture of the event itself and then understanding its aftermath.
What does this research mean for the wider community?
Valérie: The impact is big, first because it’s a major event, and also because it was very well described by the data in the paper by Jean-Yves and the team.
It has a strong influence on the community because it’s the first time that the interplay between faulting and magmatism at a ridge segment has been seen so clearly—not only the relationship between faults and magma, earthquakes, dyke propagation, and eruption, but also the way it triggered or promoted motion on the two transform faults bounding this ridge segment.
It also has a very strong impact on our understanding of mid-ocean ridge behaviour and functioning. As a team, we’ll continue working on what occurred before and after, but I think this is a milestone in our understanding of seafloor spreading.
Jean-Yves: The other impact is in terms of the experimental setup. We’ve shown that, using 15 acoustic beacons and several BPRs, you can measure these processes and set up an autonomous observatory for a few years. All the spreading ridges are quite remote from land, so they are difficult to monitor. But despite this, we’ve shown that it’s possible. Choosing the right instruments is critical!
This work was made possible through support from a number of partners and funding programmes. The 2024 and 2025 cruises were supported by the French Oceanographic Fleet (MD243 and MD247). The hydrophone array and acoustic beacons were supported by the CPER O3DO 2017–2022 programme and the European Regional Development Fund (FEDER) programme, while the bottom-pressure recorder was provided through the Equipex PIA3 MARMOR project (ANR-21-ESRE-0020).
CNRS supported the logistics of the 2024 deployment, and the 2025 maintenance cruise and data analysis were supported by the French National Research Agency (ANR) MaTISS project (ANR-24-CE49-7271). Additional support has come from the European Research Council through the SeaSALT project (grant agreement 101170619).