Renowned for its cobalt blue colour and clarity, at 1,900 m elevation, Lake Tahoe is North America’s largest alpine lake. It straddles the California-Nevada border and on all sides rise the peaked Sierra Nevada mountains. Over two million people visit the Tahoe region annually; Frank Sinatra once owned a casino on Lake Tahoe’s shore.
It’s little surprise then, that when increasing murkiness threatened the pristine quality of the lake, restoring its clarity became a regional and national conservation phenomenon – restoration efforts having escalated after Bill Clinton and Al Gore’s 1997 visit. These days, the annual State of the Lake Report, published by UC Davis’s Tahoe Environmental Research Center (TERC), warrants being publicized via a press release.
Founded in 2004, TERC, a university-wide research program, “leads research on the water quality, physical processes and ecology of Lake Tahoe and its watershed,” according to its website. “TERC’s findings and methods are used to support policy decisions at Lake Tahoe and to aid research efforts at other lakes around the world.” The program includes a state-of-the-art limnology lab at Lake Tahoe, and the Tahoe Science Center, which reaches 16,000 visitors each year.
In 2013, TERC launched the Nearshore Network, which collects water quality data at the lake’s perimeter, to elucidate nearshore processes and their effects on lake clarity.
Geoff Schladow, professor of civil and environmental engineering, and TERC’s director since its inception, describes the importance of studying the nearshore. “Most of people’s experience with the lake is at the shoreline; most of the contaminants that enter the lake are at the shoreline; most of the varied habitat is at the shore, with streams coming in and towns and cities located there. It’s a really understudied part of all lake systems, and it’s really dynamic – it’s highly variable.”
Historically, Schladow says, little data was collected in the nearshore. A limnologist, determining one or two profile sites, would invariably choose the deepest point. Schladow explains their reasoning: “Because you can take a profile from the surface to the deepest point and go home in the evening and say, I’ve sampled the entire depth of the lake, and that’s representative.” He says there is value in those measurements, but with the technology available today, his team can get at much more.
The Nearshore Network is made up of nine moorings, dispersed about the lake’s perimeter (with plans for two more to be deployed Summer of 2017). Each sits at 2 m depth and is tethered to shore.
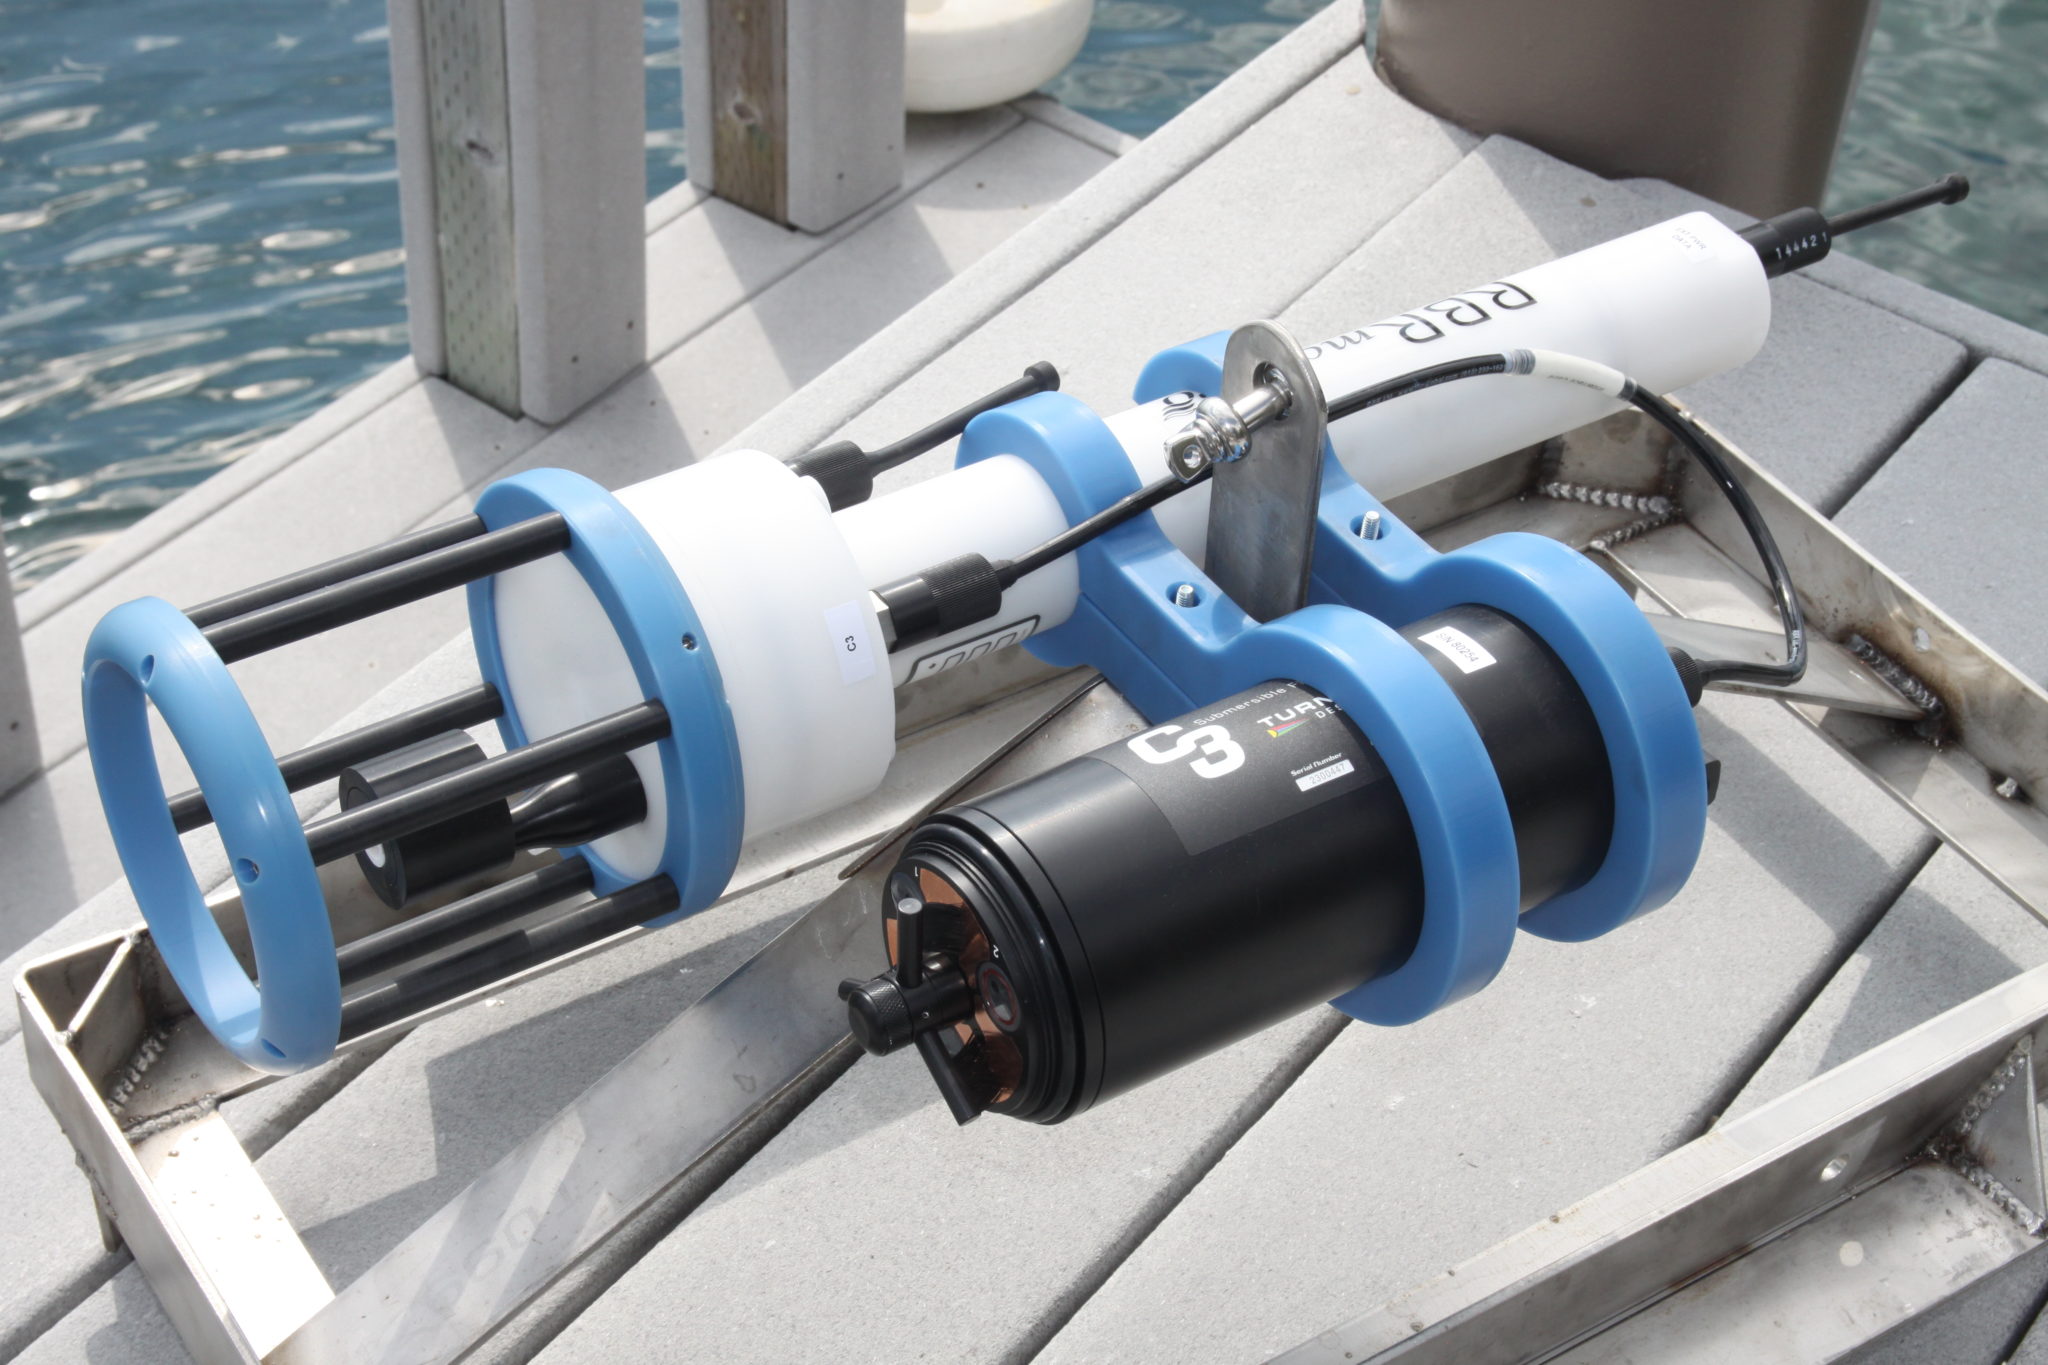
Though the project receives support both federally and from the state, the local community provides for the stations themselves. Derek Roberts, the Ph.D. student on the Nearshore Network, assembled and maintains the moorings. About the community’s backing, he says, “We have really generous homeowners who are offering us both financial support and the use of their dock to launch these stations.” At each station is an RBRmaestro CTD equipped with a dissolved oxygen sensor, and a fluorometer, measuring chlorophyll fluorescence, dissolved organic matter fluorescence and turbidity.
Novel to the Nearshore Network is the spatial and temporal resolution it’s achieving, with (soon) eleven stations sampling at 30 s intervals. Schladow explains that the measurement frequency is likely higher than necessary. By capturing too much information, they avoid misunderstanding a lake process by lacking detail.
The data is telemetered in real time via GSM to UC Davis. Monitoring from the lab, the team can troubleshoot quickly in case of problems, and equally importantly, react to events. When they see something interesting, Schladow says, they can take a boat out for extra measurements. “We’re using things we can measure, like temperature and chlorophyll to know when to go out and sample for things like nitrogen and phosphorus.”
In one instance, a prevailing wind pattern set up for several days over the lake. Schladow says from the lake there was a responding upwelling, borne out as a pulse of nutrients. “At 3 to 4 locations along the west shore, in a matter of an hour or so, we suddenly got large increases in algal concentrations. This is doubling and tripling of algal concentrations. Water from probably 100 m down starts rising to the surface at the nearshore and our stations are starting to pick up these huge increases in chlorophyll.”
Lake clarity is determined by three factors, coloured dissolved organic matter, algae, and sediment; and, though these can be measured directly, the standard method for determining water clarity, the Secchi disc, doesn’t work. So for identifying lake clarity, the Nearshore Network measurements are proxies.
‘That’s actually one of the great ironies, that a clear blue lake is something we all value, but really, it’s a desert.’
Schladow says that because Lake Tahoe’s clarity is in part about human perceptions and preferences, its conservation means maintaining the oligotrophic condition of the water. “That’s actually one of the great ironies, that a clear blue lake is something we all value, but really, it’s a desert.” Contrasting humanity’s esthetic leanings, he says, “On land we love rainforests, these lush, green places.” And what would be the highly productive lake equivalent? “Where the water was green and the fish were fat.”
Though nowhere near a green water state, the clarity of Lake Tahoe decreased by a significant one third over forty years. UC Davis began the lake’s Secchi depth record in 1968, and it continues under TERC today. The record shows that between 1968 and 1997, the Secchi depth decreased from 29.7 m to its minimum, 19.5 m. The region now has conservation policies in place, including turbidity standards, which have reversed the clarity trend.
The results of the Nearshore Network research will provide opportunities to ameliorate evidence-based policy, particularly around turbidity. Roberts, who has recently begun analyzing the nearshore data, says, “What I see from my turbidity and wave data on a very regular basis, is strong enough wave action at a large proportion of the shoreline to drive exceedances of the turbidity standards.” He explains that intermittently, sediment is stirred up into the water column. It settles out, but, without first understanding the processes, an individual turbidity measurement taken to check adherence to the standards, could appear to be in conflict with conservation efforts.
‘Once you have the descriptive science in place, you can ask a lot more management and policy-related questions.’
Roberts’ work is “a step forward in the basic descriptive research of what’s driving variability at the perimeter of lakes.” He says, “Once you have the descriptive science in place, you can ask a lot more management and policy-related questions.”
Currently, Roberts is working conjointly on three papers – three uses of the data. Firstly, to quantify patterns of wave-forced sediment resuspension at the lake’s perimeter. Secondly, to characterize nearshore water by “a robust analysis of how shifting snowmelt timing will effect the mixing of inflows.” Thirdly, to develop a detailed picture of the intermittent “seiching patterns around the perimeter of the lake, and how much that affects water quality.”
In step with its research, as part of its initial funding requirements, TERC began public outreach. They developed programs for young children, for high school students, and for adults. They also have a docent program – ambassadors of the lake, of which there are about 150. Schladow says he gives a presentation about the lake to the new batch of 20 to 30 docents each summer. “It dawned on me a few years ago, that with 16,000 people a year coming through, what I say to those 20 or 30 docents who are in that incoming cohort has a greater impact, reaches more people, than the best scientific paper I could write.”
Schladow is also making use of the popularity of the lake to enlist help from its visitors. He wonders if the variables the Nearshore Network is tracking are diagnostic. Could they conclude lake clarity is high coinciding with a time when visitors experience the opposite?
“To get at that we created a citizen science app. Ideally, thousands of people would be at the shore and they’d be taking an image and recording what’s good and what’s bad and giving it a score of one to five, and we’d be able to link that with some sort of quality index that we’re getting from the nearshore stations, to see how people’s experiences match up or don’t match up with the things that we can measure.”
And, what is Lake Tahoe’s Secchi depth now? According to the 2017 State of the Lake Report, the average for 2016 was 1.2 m less than in 2015, but still above the 1997 minimum of 19.5 m, at 21.1 m.