The ocean surrounding Southeast Alaska is a geomorphically complex area in the Northeast Pacific. Despite the complexities of this area and the numerous stakeholders interested in this ocean ecosystem, much of the region has, until recently, been lacking a regular monitoring program. In 2022, Tyler Hennon, an Assistant Research Professor at the University of Alaska Fairbanks, started a comprehensive oceanographic monitoring program of the area with the help of a network of Alaska trollers. We sat down with him to talk about this community-based science program.
The interview below has been lightly edited for clarity.
Can you give us an overview of your project in Southeast Alaska?
Tyler Hennon: Southeast Alaska hasn’t had a lot of dedicated regular monitoring efforts over much of the major waterways. Our observational goal is to get some really basic environmental data, like temperature and salinity. However, one of the hindrances to doing field work is finding affordable ship time. The Alaska Trollers Association (ATA) is a long-lived organization formed decades ago. The trollers with the ATA know that we lack baseline environmental data and that we are under-observing the system. They have a pretty vested interest in knowing what’s going on in the waters that they fish, so we’ve partnered with them as a cost-effective way to get these observations. As part of their regular fishing operations they’re able to hit up a couple key sites around Southeast Alaska and take CTD measurements.
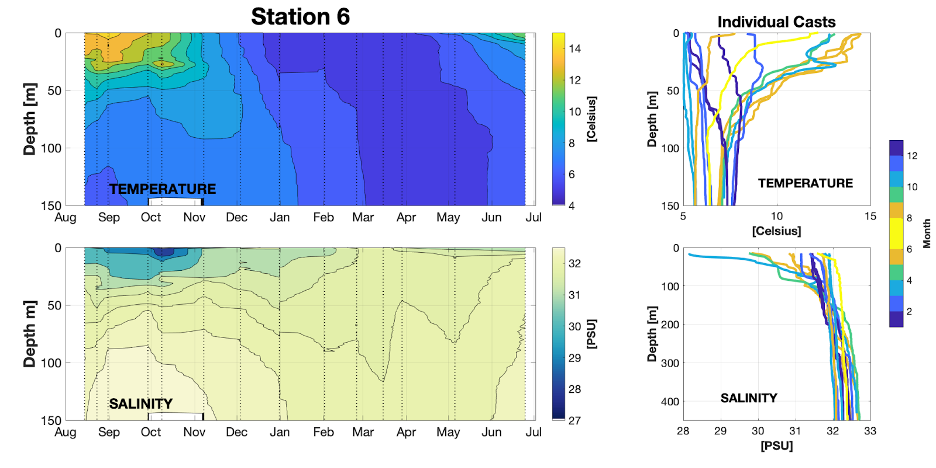
This is just the first year of the project: we started observations in August/September of 2022, so we are now getting close to a full year’s worth of data. We’re excited to be able to describe the seasonal cycle at a couple of these locations. In the second year we’re hoping to get a few more CTD instruments which will allow us to increase our spatial coverage.
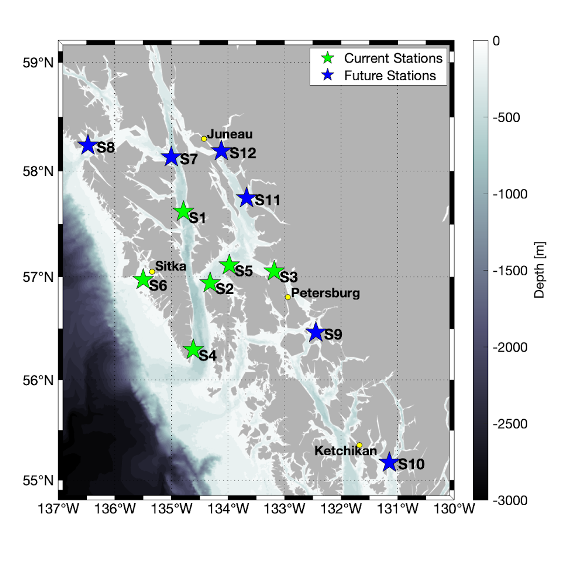
What is the current geographical extent of the sampling?
Right now we’ve got six stations in the central Southeast Alaska area. Sites range from outer waters by Sitka to inner waters near Petersburg. We’re hoping with the additional instruments we can expand up near Juneau and Stephen’s Passage, and down to Ketchikan to get the southern edge of Southeast Alaska.
What is the temporal resolution of the sampling?
We are aiming for quasi-monthly data collection, which is feasible because trollers are regularly out on the water at all times of year. We’ve had some bumps along the road the first month or two but now we’re hitting our stride and getting these six stations regularly. It’s not the exact same date every month because they don’t know exactly when they’ll be out on the water fishing but we try to play to their schedule. As long as we are getting data about once a month, that’s enough for the coarse temporal resolution needed to describe the seasonal cycle.
What CTDs are you using? How are they working out?
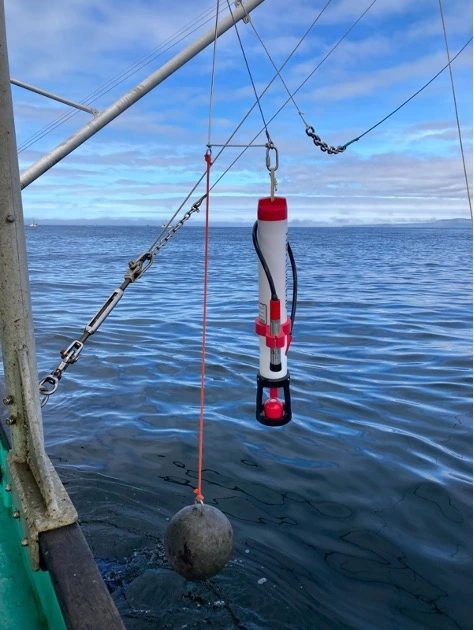
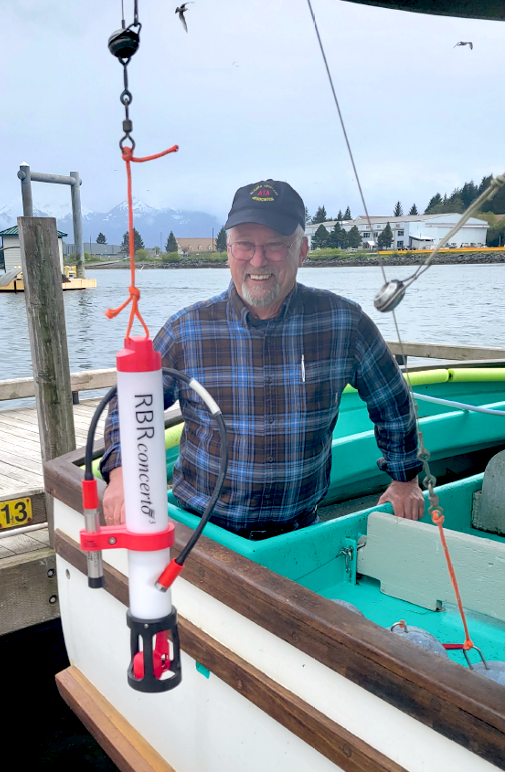
We’re using the RBRconcerto3 C.T.D for this project. The CTDs have been working out really well. The trollers are not experts in scientific equipment so the user-friendly nature of the RBRs has been really great. They’ve basically been able to twist it on, get the little buzz to make sure it’s collecting data, and then send it down to 100 or 200m, which is usually the vertical range we are getting on these casts.
How was training the trollers to use the RBR CTDs?
It was pretty straightforward and pretty minimal, to be honest. I went to Petersburg and Sitka in May 2022, and brought down an RBRconcerto3 C.T.D that we had in our lab to show some of the principle project members how it operates. With a short manual that I wrote and distributed with all the CTDs, we were able to get those principle people trained. When additional people have come on board, they have just learned from the already trained individuals. It’s been pretty smooth..
How are the RBR CTDs configured?
Of our two current CTDs, one has temperature, pressure, and conductivity (i.e. salinity) sensors, and the other has temperature, pressure, conductivity, and fluorescence (for measuring phytoplankton chlorophyll) sensors. They’re on continuous sampling mode at 8Hz and the trollers deploy them down to somewhere between 100 to 200m depth, which is great to characterise the seasonal pycnocline. That whole cast takes maybe 15-20 minutes. It’s not much skin off the trollers’ back in terms of time that they’re taking to collect these observations.
Why did you choose RBR?
We chose them because of their user-friendly products. The CTDs we use take pretty minimal training, and they’re low maintenance. We also like the ease of electronically transferring data over Wi-Fi without opening up the instruments. We gave the trollers iPads for each CTD unit, which is how they’re able to download and visualise the data from the CTD using Ruskin after they’re done with their measurements. They also use the iPads to electronically transfer data back to me in Fairbanks, where I’m able to process it and create graphs and all that. It makes it as streamlined and easy for them as possible since they’re being generous with their ship time. Those are some things we’ve really liked about the RBRconcerto3 C.T.D.
What are the long-term research goals of this project?
With this baseline data, we aim to describe the seasonal cycle of upper ocean temperature and salinity at different spots around Southeast Alaska, and, as we get more years of observation under our belt, how that changes year to year. Hopefully in 5 or 10 years, if we are lucky enough to continue getting funding for this project, we’ll be able to accurately describe what’s going on seasonally and inter-annually across many different sites. That in itself will be interesting information that may point to different driving mechanisms that affect the waters of Southeast Alaska, such as intrusions from Pacific waters and forcings from the Gulf of Alaska, or anomalies in the freshwater runoff from glacial fjords.
Beyond that, we are hoping that this environmental data is useful just as basic context for other studies. I am a physical oceanographer and am primarily interested in the physics of the ocean. But temperature variability is important for lots of marine organisms, so possibly we can see some correlations between, for example, if it’s really warm one year across Southeast Alaska and how that might affect certain marine organisms and their overall health. I think this will be particularly useful for explaining the dynamics of phytoplankton, which are the base of the food web. Obviously fisheries and the fishing industry is a big part of the Southeast Alaska economy, so anything we can do to help describe what might be going on in the lower trophic levels – which might ultimately affect salmon – is going to be important.
How has the response been from the fishing community?
It’s been good. I think right now we have more interested captains than RBR instruments, so once we get a few more we’ll be able to expand our footprint. The interest has been great. I’ve been able to go to Petersburg and Sitka, and give a couple town-hall-style presentations. These presentations were half basic oceanography and half a project update on what we’ve learned from the observations since last summer. There was a great turn out at both events so I think there’s really a lot of local engagement to know more about what’s going on in their own backyard.
Are the trollers interested in learning anything specific?
I think the trollers are definitely interested in seeing if there is any correlation from thermal or salinity layers and their success in catching salmon or other target species. There’s a well established program like ours on the east coast led by Glen Gawarkiewicz from the Woods Hole Oceanographic Institute (WHOI); fishermen that participated in that program were able to find some correlations between what they were seeing in the CTD data and their fishing success. As a result, they started to go out and use the CTDs for their own fishing purposes too, and generated a bunch of data that could also be used for science. That’s what we’re trying to encourage for our participants: they don’t have to just go use the CTDs for the monthly sites, they are free to go and collect more data which, ideally, will be of benefit to them and the science.
Some of the trollers that I work with have been fishing for over 50 years, so in certain ways I don’t feel like I can teach them a lot about Southeast Alaska. It’s where they’ve lived and made their livelihood, so they have this intimate lay of the land. I’m just hoping that I can give them one more tool in their toolbox to think about what’s going on in the ocean.
They’ve also initiated what they’re calling an electronic logbook program. Between the mid 70s and early 90s, they created a paper logbook to record different environmental parameters, including some fishing related parameters like species of catch and sometimes their stomach contents. They were recently funded for a couple of years to revive the program and make it digital, recording their data on iPads. Ten volunteers will collect environmental data (including ocean surface temperature) and catch information during their fishing trips. I think the digital logbook program and ours will go really nicely together, where the logbook program will get widespread near-surface measurements and higher trophic level information and our core stations will provide key context of deeper ocean dynamics.
What are some things the trollers have taught you about the area?
How complicated Southeast Alaska is in terms of its geomorphology and the circulation. It’s definitely something that I’ve come to appreciate more and more by talking with the trollers.
What are the big take-aways from the project so far?
I think we need to get some more data under our belt just to see what’s normal in the region. We don’t know yet what’s normal versus abnormal, apart from these classical seasonal evolutions that you see everywhere.
What I want to highlight is that we have this really nice intersection between the interest of local stakeholders and science, and it’s a good example of industry and academia teaming up and creating a pretty useful data product that will also hopefully be of interest to the general public. We don’t want to just send the trollers out to collect data that ultimately just gets published in a scientific paper, with little interactions thereafter. I’m hoping it’s much more community-based, where results are broadcast and of interest to the general public as well. That’s the angle that I’m going for with this project: both scientifically useful but also digestible and relevant to the trollers that are collecting the data and general stakeholders in Southeast Alaska.
What are the next steps in the project?
I’m excited to just keep on plugging along for the most part! There are some things I’m definitely excited for in the second year of the project, like getting more RBRconcerto3 C.T.Ds to expand our physical footprint. We’ll also look to recruit a few more captains but I think that shouldn’t be too much of an issue since there seems to be a lot of interest within the troller community.
I’m mostly just excited to keep seeing the data roll in and see how the observations we’ve collected in the last year compare to upcoming years, and start building up that baseline to see what’s normal in Southeast Alaska. I’ll be interested to see what are some anomalous years and what might be causing those anomalies. We can then start linking the physical drivers to the system once we get that baseline.
This project was initially made possible due to the significant support from the Alaska Sea Grant, the Alaska Ocean Observing System (AOOS), and the Pacific Salmon Commission. Planned ongoing support from AOOS after an initial 2.5 years will allow the project to continue.
Story by Krysten Rutherford